
In the 1980s a political scientist in New Zealand noticed something in the technical manuals of IQ tests that the people publishing them had not made much of. Every time a test was restandardised, the new sample did better than the old one. The test was being made harder, quietly, every generation, just to keep the average at 100.
James Flynn gathered the data across fourteen countries and published it in 1987. Scores had been climbing for as long as anyone had been measuring, at roughly three points a decade (Flynn, 1987). Someone scoring exactly average in 1950 would have been well below average by the 1990s, measured against the newer group.
This is the Flynn effect, and it is the single most awkward fact about IQ testing. It is also the reason your score depends on when the test you took was built.
Why a rising average is a problem
An IQ score is not a measurement of anything absolute. It is a comparison against a reference group, fixed so that group averages exactly 100. If the population improves and the reference group does not, every score drifts upward until someone resets it.
| If scores drift over time, then | What follows |
|---|---|
| A test normed in 1990 scores you against 1990 | You would score several points higher on it than on a current test |
| Tests must be restandardised every decade or so | This is why Wechsler scales get new editions rather than small fixes |
| An old score and a new score are not comparable | A figure from your own school days cannot be compared to your child’s today |
| The gain was concentrated in abstract reasoning | Vocabulary and general knowledge moved far less than matrix puzzles did |
| Change this fast cannot be genetic | Gene pools do not move in thirty years. Something environmental did |
This is why intelligence tests come in numbered editions, and why using an outdated one is a real methodological error rather than a minor inconvenience. If you have ever wondered why a professionally administered test costs what it does, part of the answer is that restandardising on a fresh representative sample is expensive and has to keep happening. The mechanics of that process are covered in how raw answers become an IQ score.
Norms also differ between countries, not just between decades, which is why the children’s test is normed and presented separately for each language: IQ-test för barn (Swedish), IQ-test voor kinderen (Dutch), 儿童IQ测试 (Chinese) and test QI per bambini (Italian).
What was rising
The gains were not spread evenly, and the pattern is the most interesting part.
Vocabulary and general knowledge barely moved. Arithmetic moved a little. The large gains were concentrated in exactly the kind of abstract pattern reasoning that matrix tests measure: working out an unstated rule from a visual sequence.
Flynn’s own reading was that twentieth century life had trained people to think in categories and hypotheticals in a way earlier generations had no reason to. Ask someone in 1910 what a dog and a rabbit have in common and you might be told that you use dogs to hunt rabbits, which is a perfectly intelligent answer about the real world. The answer the test rewards is that both are mammals, which requires treating the question as an abstract classification exercise. Schooling, and a century of increasingly abstract work, made that habit of mind ordinary.
That has a direct bearing on whether nonverbal tests are really culture-free. They are less culture-bound than a vocabulary test. They are not outside culture altogether, and the Flynn effect is the proof: the thing that rose fastest was performance on the supposedly culture-free items.
Then it stopped, and reversed
From the 1990s onwards, several countries started recording declines. Norway, Denmark, Finland, the UK and others. The obvious explanations were demographic, and they were uncomfortable ones: changes in who was having children, or in who was being tested.
Norway was able to settle it, because Norwegian men were conscripted and tested for decades, which produced an enormous dataset including brothers. Bratsberg and Rogeberg compared scores within families, between brothers born in different years. That comparison removes the demographic explanations entirely, since brothers share parents and background.
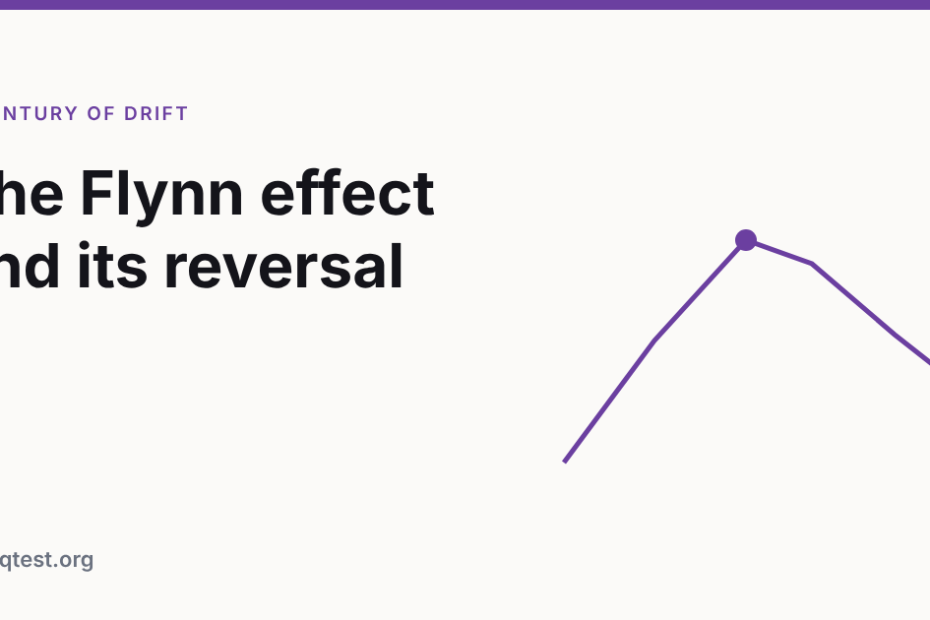
The rise and the fall both showed up within families. Scores climbed about 0.26 points a year for cohorts born between 1962 and 1975, then turned and fell (Bratsberg and Rogeberg, 2018). Whatever caused it was environmental, and it was something that changed for children growing up in the same household a few years apart.
Nobody has pinned down what. Changes in schooling, in reading habits, in how attention gets spent, in nutrition, in screen use: all proposed, none established. The finding that matters is narrower and firmer. The cause is environmental, which also means heritability does not mean what people take it to mean.
As a mother, this is the bit I find steadying
My own mother was tested at school in the 1960s and was told a number, which she repeated to me approximately once a year for my entire childhood, usually as evidence in an argument.
When I finally understood the Flynn effect I did the arithmetic on her number. Measured against the standards my daughter is measured against, it would land several points lower. Measured against her own contemporaries it was exactly what she was told. Both readings are correct and they are not comparable, which is a strange thing to explain to your mother.
What it cured me of was treating any score as a fact about a person rather than a fact about a person in a population at a time. My mother’s number, my daughter’s number and my own are three different measurements taken with three different rulers. That is not a flaw to be corrected. It is what the instrument is.
What to take from it
Use a current test. An old score, your own or anyone’s, is a comparison against a group that no longer exists.
Do not compare a score from your school days with your child’s result today. They are not on the same scale, whatever the numbers look like.
And treat the whole thing as evidence that scores move. They moved for entire nations, in one direction for eighty years and then the other, by far more than any training study has ever produced. If you want the practical version of that question for yourself, whether you can train your own score has a more precise answer than you might expect.
For a current reading on a current scale, the free IQ test for kids is age-normed, and the adult IQ test reports a range rather than a single figure, for reasons this whole article is really about. The percentile is the part worth reading.
References
- Flynn, J. R. (1987). Massive IQ gains in 14 nations: What IQ tests really measure. Psychological Bulletin, 101(2), 171-191. doi:10.1037/0033-2909.101.2.171
- Bratsberg, B., & Rogeberg, O. (2018). Flynn effect and its reversal are both environmentally caused. Proceedings of the National Academy of Sciences, 115(26), 6674-6678. doi:10.1073/pnas.1718793115